s.o.l. meter
Speedometer Input

|
www.igglybob.com s.o.l. meter Speedometer Input |
|
the main - main page - about me - l.o.u.n.g.e. - r.e.t.a.r.d. - s.o.l. meter - s.c.r.e.a.m. - videos the l.o.u.n.g.e. - overview - 2006 edition - 2007 edition - 2008 edition - control the s.c.r.e.a.m. - main page - tech review - proposal - draft summary the r.e.t.a.r.d. - overview - assignment - proposal - requirements - timeline - the core the s.o.l. meter - overview - car modification - meter design - meter input |
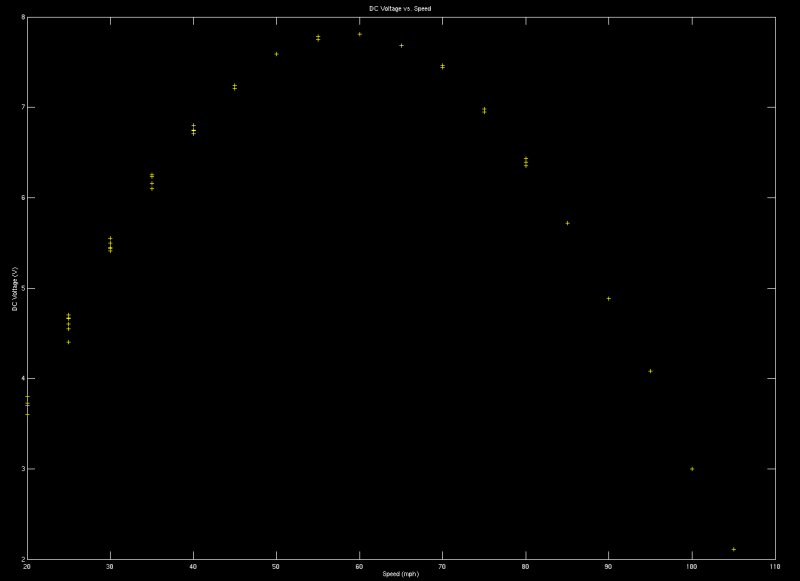
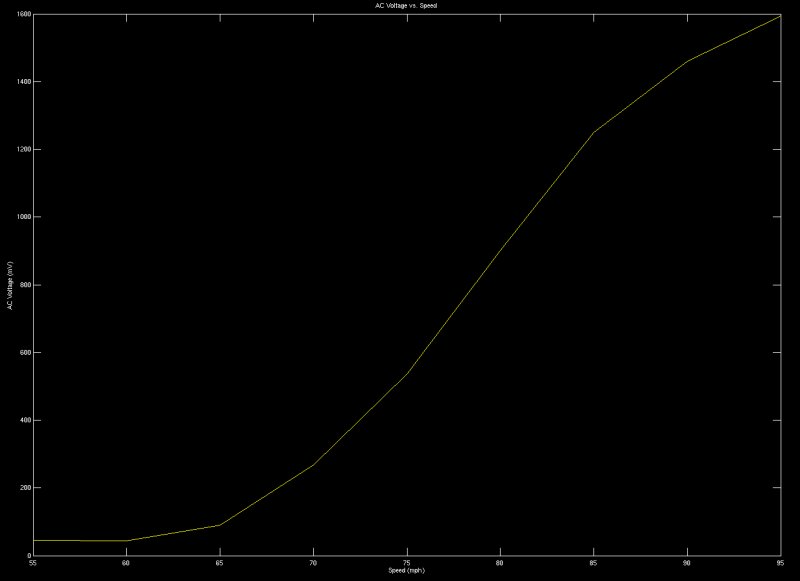
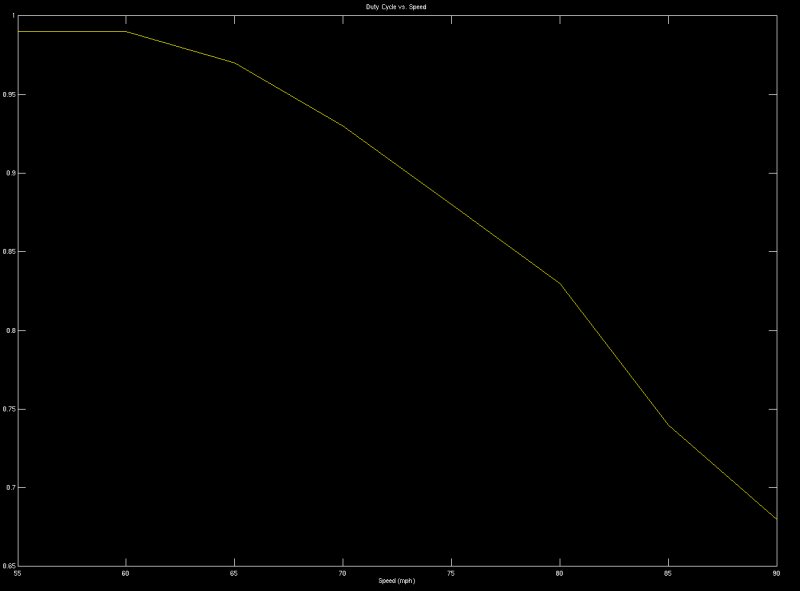
I. Overview of Situation When the s.o.l. meter was designed (see [1]), it was assumed that the speedometer's relation between voltage and speed was linear. At this time, this seemed a reasonable assumption, as all the data taken had been for speeds under 40mph. However, when readings were taken of above 50mph, it became clear that the curve was, in fact, not linear. This presents a large problem, as the speedometer's inputs will need to be modified in some way to provide a linear relationship. II. Determination of Waveform As no oscilloscope was present when the data were obtained, only certain readings could be taken: DC voltage, AC voltage, and duty cycle, all measured against speed. The data were then transformed into more helpful plots using MATLAB. The figures below show the different results.  Figure I. D.C. voltage plotted against speed.  Figure II. A.C. voltage plotted against speed.  Figure III. Duty cycle plotted against speed. III. References [1] http://www.igglybob.com/projects/sol_meter/meter_design.php |